Week forty one of ice drift (08- 15 June 2015)
Ice drift
The ice camp drifted 35 nautical miles (66 km) along the lower continental slope of Northeast Greenland during the week (Fig. 1). We have moved one degree of latitude south over the last two weeks. The motion at the beginning and end of the past week was parallel to the major shear zone off the coast east of Station Nord (Fig. 2). Thursday and Friday, we moved closer to shear zone and all patches of open water between us and the coast disappeared. Through Wednesday, the westerly winds were due to a low pressure near the North Pole. Later a low pressure over the Barents and Kara seas gave us winds from the north and an ice drift towards the coast of Greenland. The drift speeds have been over 0.2 knot for most of the week.
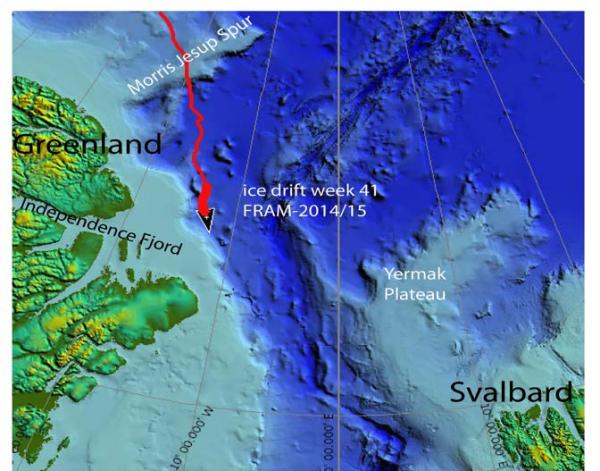
Fig. 1. The drift of FRAM-2014/15 during week 41, 08- 15 June 2015 (short thick red line).
Sea ice dynamics
The half meter wide crack right behind the hovercraft and two other parallel cracks have closed. A 10 meter wide lead which opened on 31 March about 35 meter in front of the hovercraft has also closed and formed a 2 meter high pressure ridge. These features run roughly parallel to the coast. Our motion has been to the south-southeast parallel to the shelf break, but also had a component towards the shear zone during the middle of the week. As we see on the satellite image in Fig. 2, there is no open water between our camp and the coast. We are prepared and alert for any ice activity that may necessitate a move.
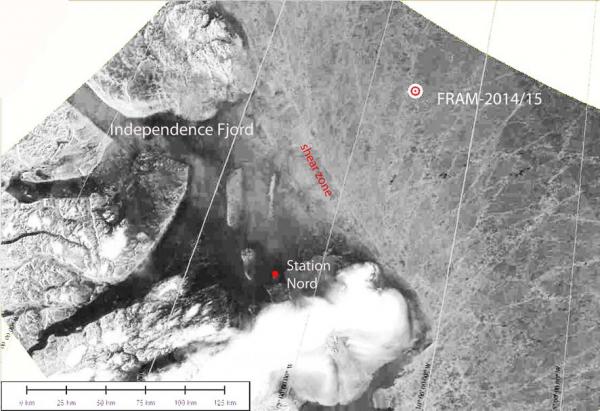
Fig. 2 Satellite image (Synthetic Aperture Radar) from 12 June courtesy of Danish Meteorological Institute (http://ocen.dmi.dk/arctic/images/MODIS/Nord/20150612s01a.ASAR.jpg) showing ice distribution and fracture patterns northeast of Greenland. Note the shear zone for ice motion off the coast.
Camp life
The summer weather is mostly a situation with low clouds, and low terrain contrast from the diffuse light. The visibility is low. We had light rain two days this week. In between were a couple of gorgeous days. The temperature on Monday was +7 °C and between 0 °C and -3 °C the rest of the week.
Part of the daily routine is making adjustments as best we can to protect the frozen food from thawing. We cover the boxes with snow and insulation mats. The hovercraft cabin and the engine bay have had their spring cleaning. The other part of the routine is keeping the instruments going. Over and over again, we are faced with situations which demonstrate the advantage of having "boots on the ice" to maintain all the marvelous data collecting technologies. This week Audun recovered an AWI mass balance buoy which had stopped working three weeks after it was deployed from Polarstern near our camp on the 30 August last year. A similar buoy belonging to the Finnish Meterological Institute was recovered last week. The instrument had stopped reporting good data last fall. Our own five autonomous bathymetry buoys have stopped working. Two have been recovered, one we know has been taken by ice during the dark season, and three searches for the remaining two have been unsuccessful. An additional autonomous echo sounder buoy was activated in camp, but encountered problems with detecting and locking on the bottom echo. This tuning problem was solved in consultation with Chr. Michelsen Research in Bergen who again consulted the US manufacturer.
A third part of the routine is keeping your personal things in a kind of order. After over 9 months on the ice your inventory of socks are depleted and holes need to be mended (Fig. 3). If pushed hard enough, we are actually capable of knitting new socks.
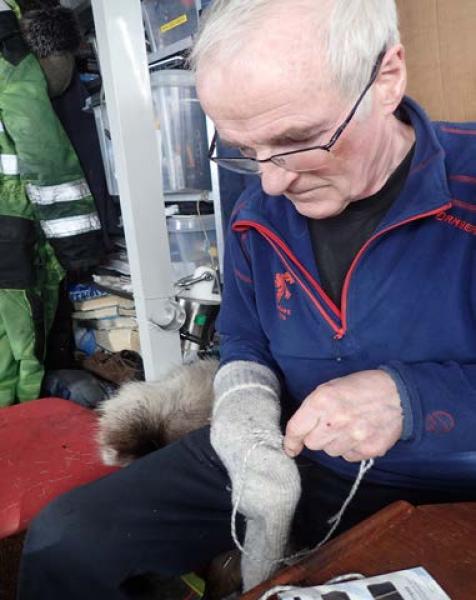
Fig. 3 A concentrated left-hander mending his socks
Science
Underway continuous measurements:
Bathymetry:
- Syquest echo box and autonomous data acquisition reporting via Iridium to CMR, Bergen
Oceanography:
- current meter suspended at 150 meter below the ice.
Atmosphere:
- measurement of incoming and outgoing radiation from the ice surface
- surface infrared skin temperature
- sun time
- Aanderaa weather station
Station work
- 6 CTD casts to 1000 meter depth; one every 5 nautical mile
Oceanography - how can FRAM-2014/15 contribute?
Water masses are characterized by their temperature, salinity, content of dissolved gases and elements which can be utilized as tracers. These parameters are used to identify the water mass source region, the degree of mixing between water from different sources, the residence time in a region and to compute the large scale circulation assuming a geostrophic balance of forces. The basic parameters; salinity and temperature are recorded by a Conductivity, Temperature and Depth profiler (CTD) lowered through the water column. Our hovercraft Sabvabaa is equipped with a light version of this instrument (Fig. 4). Sensors to record dissolved gases can be added to the instrument, but studies of tracers require in situ water sampling.
Oceanography and CTD profiling are part of almost every scientific expedition into the deep Arctic Ocean. As reported by Bourgain and Gascard (2011), over 18.000 vertical CTD profiles were made between 1997 and 2008 (Fig. 5). Two thirds of these were obtained during the fourth International Polar Year (2007-2008). Most of the casts have been made during summer expeditions. If we overlay the drift track (thin red line) of FRAM-2014/15 during 2015 on this map, it is apparent that our drift traverses an area not covered by this effort as well as later surveys. The ice is simply too difficult for non-nuclear icebreakers and too deformed to land a light air plane during the March-April weather window for flying. We made a total of 13 CTD casts to full water depth across the Lomonosov Ridge from the Makarov Basin to the Amundsen Basin (thick red line in Fig. 5) during the height of the winter. Our fuel consumption and projected reserves at the time did not allow this program to continue. Fortunately, we have been able to resume CTD casts down to 1000 meter depth for the remainder of the drift following a resupply from an air drop by the 333 Sq. of the Norwegian Air Force in early April over Morris Jesup Spur. A CTD cast is made every 5 nautical mile.
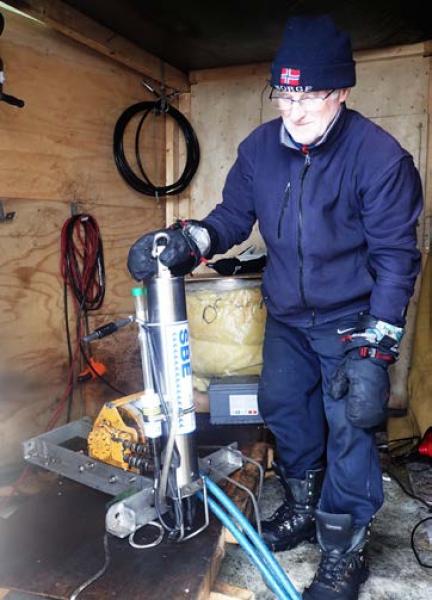
Fig. 4 The CTD profiler before launch
As stated in our report for week 37, our oceanographic objectives for this part of the drift are:
i) augment ongoing oceanographic research in the Independence Fjord area by the group from Aarhus University at the new Villum Research Station, and
ii) contribute to the data base for determining where and how much of Atlantic Water from the Amundsen and Nansen basins joins the flow of water which has made the complete polar basin loop.
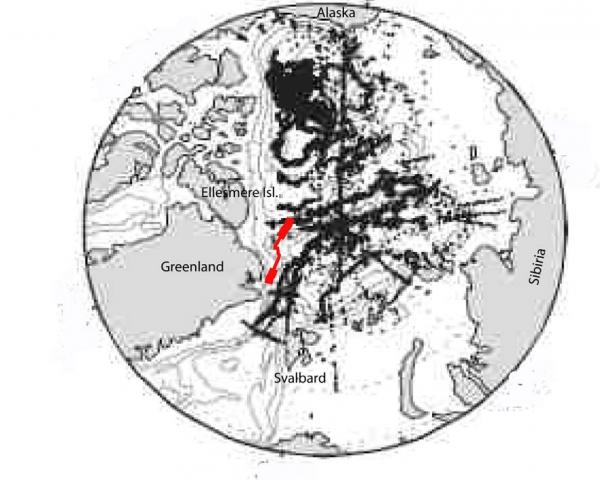
Fig. 5 Map of the distribution of CTD stations in the Arctic Ocean from Bourgain and Gascard (2011). The drift of FRAM-2014/15 during 2015 is indicated by the thin red line and sections of the drift track with CTD casts by the thick red line.
In Fig. 6 is shown the temperature and salinity profiles from two of our stations (station 153 and 163) 45 nautical miles (83 km) apart south of Morris Jesup Spur. The temperature profile show the warm (>0 °C) Atlantic Water between 200 and 600 meter depth. The Atlantic Water enters the Arctic Ocean through the West Spitsbergen Current and also through the Barents Sea. It flows as a boundary current around the entire polar basin and deflects into the sub-basins along its path to fill the entire Arctic Ocean at this depth interval. The warm water is up to +6 °C vest of Svalbard, but has cooled down to +1 °C off the coast of Northeast Greenland (Fig. 6). This enormous heat reservoir would easily melt all the sea if it had not been for the insulation represented by the overlying less saline and lighter waters. Salinity has the greatest effect on density at low temperatures. The uppermost mixed layer (20-50 meter thick) has the lowest salinity and is formed by ice melting and river input. Below is a zone of increasing salinity down to over 200 meter depth (Fig. 6). This is called the halocline and the salinity gradient is the crucial factor for maintaining a perennial ice cover.
Density increases with increasing salinity at depth and creates a stable stratification which prevents heat from the warm Atlantic Water to reach the surface by convective transport. Convection is the most effective form of heat transport. The vertical green bar to the right in Fig. 6 shows the reach of the thermistor string (300 meter depth). The string has accumulated 6 months of data from the fall and winter situation to monitor the vertical heat transport from the Atlantic Water to the underside of the ice (Principal investigator Ilker Fer, Univ. of Bergen)
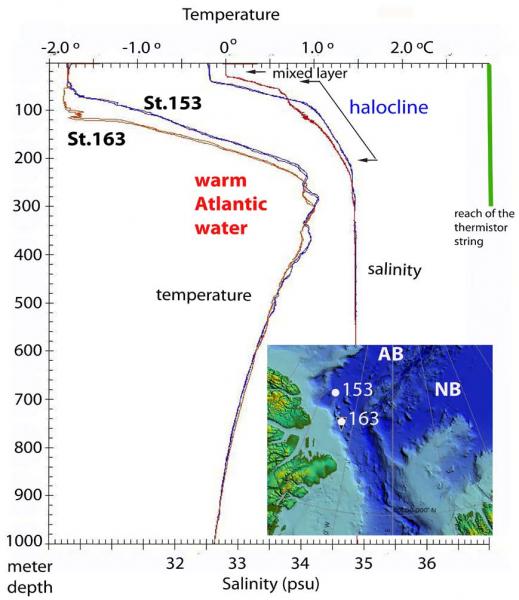
Fig. 6 Temperature and salinity profiles from stations 153 and 163 off the coast of Northeast Greenland. Locations are shown in inserted map. The scale for the salinity is at the bottom of the figure.
The water at station 153 and 163 is assumed to have contributions from Atlantic Water modified along three different paths; one having made the full curcuit along the margin of the entire polar
basin, one from recirculation in the Amundsen Basin and one from the Nansen Basin. In Fig.7 we compare the results from station 153 and 163 with typical water mass characteristics of the Amundsen and Nansen basins as presented by Rudels (2009). Station 153 and 163 appear to be closest to the characteristics of water having made the loop within the Amundsen Basin
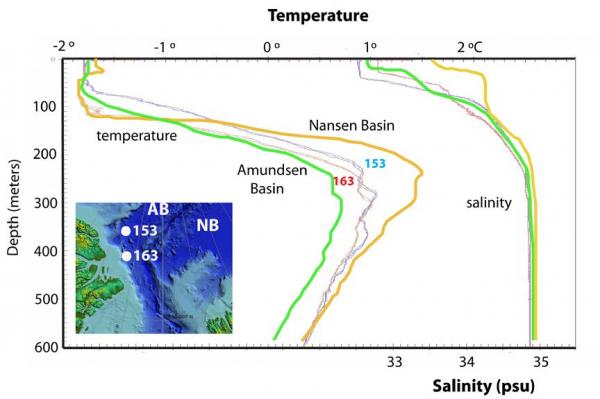
Fig. 7 Temperature and salinity profiles of station 153 and 163 compared to properties of upper water masses in the Amundsen (AB) and Nansen (NB) basins from Rudels (2009).
Another significant oceanographic data set obtained during FRAM-2014/15 is the current meter which was successfully recovered after being suspended for 8 months below the ice at 2000 meter depth. The record starts in the Makarov Basin and ends in the Amundsen Basin. The instrument was raised to 1050, 800 and 660 meter to cross Lomonosov Ridge five times.
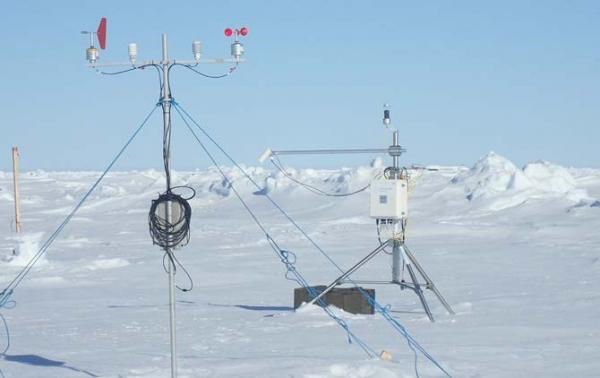
Fig. The radiation flux instrument (right) and the weather station (left)
Our surface instruments for measuring the radiation flux (Meterological Institute, Oslo) and the weather station (Univ. of Bergen) works well.
Wild life
Ivory gulls are visiting every day.
Life in the High Arctic is treating us well.
Yngve Kristoffersen & Audun Tholfsen
Daily reports
Monday 08 June
Position: 83° 11.2' N, 14° 17' W, temperature + 7 °C, wind 1 knots from the SE. Ice drift 0.2 towards SE. The 0.5 m wide crack beyond the hovercraft has closed to 0.2 m. Made CTD cast down to 1000 meter depth. Audun collected the thermistors from the string and stored them inside the hovercraft. Started cleaning the sump in the engine bay and checked bilge pumps.
Tuesday 09 June
Position: 83° 07.07' N, 13° 45.9' W, temperature 0 °C, 1009 hPa, wind 12 knots from the W. Ice drift 0.3 knot towards the SE. Light rain today. The crack behind the hovercraft has closed completely. Made CTD cast to 1000 m depth. Audun recovered the AWI mass balance buoy which had ceased to function three weeks after deployment 30 August last year. The snow shelter protecting our Zarges boxes with food collapsed in the mild weather and had to be restored. The CMR bathymetry buoy in camp operate on a 10 minutes repetition rate which turns out to be hard on the batteries - changed to two 115 Ahr batteries. We saw three Ivory gulls in camp today.
Wednesday 10 June
Position: 83° 00.9' N, 13° 11' W, temperature - 1 °C, 1014 hPa, wind 18 knots from the W. Ice drift 0.35 knot to the SSE. White-out conditions. Checked the radiation flux instruments and the weather station. Made a CTD cast to 1000 m depth. Started to run a check of our ARGOS 96010 tracker buoys and coordinated with Chr. Michelsen Research, Bergen for reports. Audun transferred two drums of fuel to the hovercraft main tanks. Shipment of our storage container still at AWI, Bremerhaven is finally underway to Longyearbyen. Six Ivory gulls visited the camp at the same time. Audun made a repeat GPS measurement to determine the azimuth of the hovercraft which is now 260 degrees as compared to 241 degrees on 26 April.
Thursday 11 June
Position: 82° 54.52' N, 12° 56.3' W, temperature - 3 °C, air pressure 1025 hPa, wind 12 knots from the N. Ice drift 0.15 knot towards S. A glorious day. Felt a shock at 0137 GMT and thought it may have been an earthquake from the Lena Trough below. However, both NORSAR, Univ. of Bergen and GEUS did not see any events recorded on the Svalbard stations or at St. Nord. The shock could have been related to the start of a pressure ridge about 35 meter in front of the hovercraft. Made CTD cast to 1000 m depth. Both ARGOS tracker buoys report good positions - batteries checked 12.4 and 11.9 volt. Audun downloaded all data recorded by the CTD to date. Have made an assessment of all the cargo beyond the maximum payload of the hovercraft and estimate the weight to be over two tons.
Friday 12 June
Position: 82° 50.1' N, 12° 55.9' W, temperature 0 °C, pressure 1023 hPa, wind 14 knots from the N. Ice drift 0.2 knot towards the S. A beautiful day. The former lead with present ice thickness of 0.6 m about 35 meter from the front of the hovercraft closed and quietly formed a 2 meter high pressure ridge. The Syquest echo box in camp does not find the bottom reflection. Water depth is around 3000 meter. CMR consulted the Syquest company and adjustments were made to resolve the issue. Made a CTD cast down to 1000 meter depth. Audun made a 5 hour ski trip to search for the two autonomous bathymetry buoys (# 4 and #5) not accounted for, but had no luck. This was our third unsuccessful attempt. Completed a major spring clean-up of the hovercraft cabin. Corresponded with Bert Rudels on oceanographic issues.
Saturday 13 June
Position: 82° 48.5' N, 12° 59.1' W. Temperature -1 °C, air pressure 1021 hPa, wind 12 knot from the N. Ice drift 0.2 knot towards the S. White-out conditions. We are drifting on a course that brings us closer to the major shear zone along the coast, but still about 40 km away. Made a CTD cast to 1000 meter depth. Had the generator going all day to melt snow for drinking water - we need to replenish every two weeks.
Sunday 14 June
Position: 82° 42.8' N, 12° 56' W, temperature -2 °C, air pressure 1012 hPa, wind 18 knots from the N. Ice drift 0.3 knot to the S. White-out conditions and light snow fall, 5 cm in total. Checked the radiation flux instrument - data logger battery is 11.65 Volt. Worked on the weekly report.